
Article summary: Most “cash flow vs profit” advice tells you to invoice faster. That fixes a symptom, not the cause. The real problem is working capital — the cash your business needs locked up in operations between when you spend money and when clients pay. Low gross margin amplifies the gap. Bennett Financials runs a 60-15-15 diagnostic that traces cash crunches back to the structural cause: pricing, labor efficiency, and capital design. Here’s the math.
The real reason your profitable business has no cash
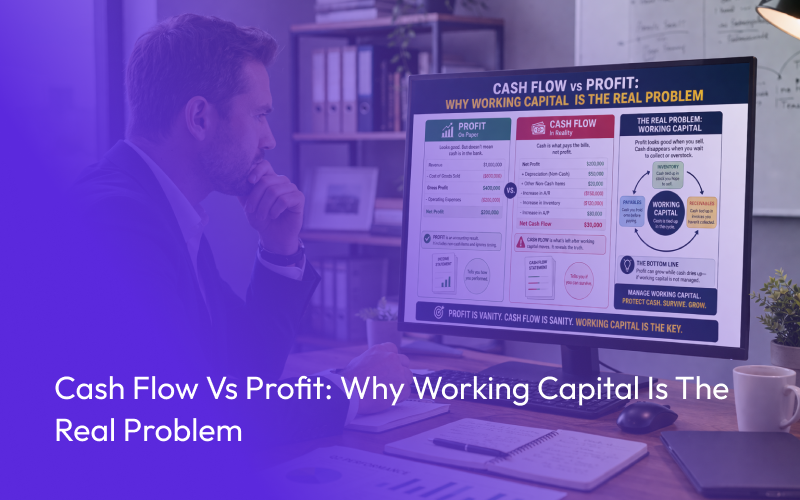
Profit is an accounting number. Cash is a structural number. The gap between them isn’t your AR aging report — it’s your working capital. And working capital is set by your gross margin, not your invoicing software.
According to a U.S. Bank study cited by Entrepreneur, 82% of business failures trace back to inadequate cash flow management — not bad profitability. Most of those businesses had positive net income on the day they ran out of money.
I run a fractional CFO practice for service founders doing $1M–$20M, and the founders who land on my calendar with this problem have almost always already tried the obvious fixes. Faster invoicing. Tighter terms. Deposits up front. They’re still cash-tight. Because the actual problem isn’t how fast money comes in — it’s how much working capital their cost structure forces them to carry.
This article is the diagnostic walkthrough. Skip the band-aids.
Cash flow vs profit, in one paragraph
Profit is what your P&L shows after subtracting expenses from revenue under accrual accounting — you book the revenue when you earn it, not when the client pays. Cash is what’s actually in your bank account today. A $100,000 project signed in January with Net-30 terms shows up as profit immediately and as cash 60 days later. That’s the whole gap. Now let’s talk about why it kills businesses.
Working capital is what you actually mean
When founders say “I have a cash flow problem,” they usually mean a working capital problem. Different thing.
Working capital is the cash your business needs locked up in operations to keep running between when money goes out and when money comes in. It’s the float. Specifically: unpaid invoices (accounts receivable), work you’ve done but not yet billed (work-in-progress), prepaid expenses, minus the cash you owe vendors that hasn’t gone out yet (accounts payable).
Think of it like this. If you bill clients Net-30 and pay your team weekly, you’re floating four weeks of payroll out of your own pocket. That float is your working capital requirement. It’s not a one-time hit — it’s permanent. Every dollar of revenue growth requires more working capital tied up in the same float. Grow 50%, your working capital requirement grows roughly 50%.
That’s why “we’re profitable but cash is tight” usually means “we’re growing into a working capital wall.”
Why low gross margin makes the cash problem 2x worse
Here’s the part nobody runs the math on. Your working capital requirement isn’t just about timing. It’s about how much of every revenue dollar is cost.
Picture a $4M law firm running a 50% gross margin. For every $1M in revenue, $500K is direct delivery cost — attorneys, paralegals, contract reviewers. That cost goes out the door in real time, weekly payroll. The revenue comes in months later.
Now picture the same firm at 60% gross margin. Same $1M in revenue, but only $400K in direct cost. The float they have to carry is 20% smaller. Per dollar of revenue, the cash conversion cycle is shorter and the working capital lock-up is lower.
Run that math at scale. A $4M firm at 50% GM with a 90-day cash conversion cycle is floating roughly $500K in working capital ($4M × 0.50 × 90/365 ≈ $493K). The same firm at 60% GM floats $395K. Same revenue. Different gross margin. About $100K less cash trapped in operations — every single day, forever.
That $100K isn’t a one-time savings. It’s permanent liberated cash. It’s what funds your tax bill, your distributions, your hiring without a credit line.
This is why I tell every founder: pricing is a cash flow lever, not just a profitability lever. Most of the law firms I work with treat pricing as a P&L conversation. It’s a balance sheet conversation.
The cash conversion cycle math, at $4M revenue
Let’s run the numbers on a real founder situation.
According to the Clio Legal Trends Report, the median total lockup for law firms is 92 days — 47 days from work performed to invoice sent (realization lockup), 27 days from invoice to payment (collection lockup), and the remainder in dispute and write-off cycles. LeanLaw’s industry analysis puts the average wait for payment at 52 days. And industry data shows the average law firm collects 85% of what it invoices, with 22% revenue leakage from time entry to bank deposit when you combine unbilled time and uncollected invoices.
Take a $4M firm at 50% GM with a 90-day total lockup:
- Daily revenue: ~$11,000
- Daily delivery cost: ~$5,500
- Working capital tied up: $5,500 × 90 = $495,000 permanently locked
Now lift gross margin to 60% (close-rate-driven price increase, no new clients, no new headcount):
- Daily delivery cost: ~$4,400
- Working capital tied up: $4,400 × 90 = $396,000 permanently locked
That’s $99,000 in cash freed up. Without changing a single client, without speeding up a single invoice, without hiring an AR clerk.
Now do it the other way. Keep gross margin at 50% but cut lockup from 90 days to 45 days through aggressive collections — the kind of result that takes a year to engineer:
- Working capital tied up: $5,500 × 45 = $247,500
That’s $247K freed. Better outcome, much harder to execute, doesn’t address the underlying structural cost.
The point isn’t that AR speed doesn’t matter. It does. The point is that gross margin compounds with every other lever. Fix it first, and a tax strategy that matches the business model can take what’s left and convert it to permanent capital instead of a tax bill.
Want to know where your business sits against the 60-15-15 standard? The Scale-Ready Assessment runs your actual numbers, builds a custom tax strategy, and produces a full enterprise value report. Free for US-based service businesses doing $1M–$20M. Book your free Assessment — 15 spots per month.
What faster invoicing actually fixes (and what it doesn’t)
I want to be honest about this. AR follow-up is not nothing. Industry data via k38 Consulting shows law firms that adopt consistent follow-up procedures see roughly 40% improvement in payment speed. That’s real money.
But here’s what I’ve watched across my client base: faster invoicing on a 50% gross margin business still leaves you cash-tight as you scale. You can compress the cycle from 90 days to 45 days and still find yourself short on cash at $7M revenue, because the structural lock-up grows with every dollar of new revenue. You’re running on a treadmill.
You can’t collect your way out of a structural undercapitalization problem.
The diagnostic order matters: pricing first (gross margin), labor efficiency second (delivery cost per dollar of revenue), AR speed third. Reverse that order and you’re polishing the symptom while the cause keeps generating new symptoms.
Case study: Virtual Counsel
Virtual Counsel, a legal services firm, came in with a textbook version of this problem. Growing fast — but expenses outpacing revenue, no proactive tax planning, finance running purely reactive. They were profitable on the income statement and tight on cash every month.
What we did: a deep profitability diagnostic to find the root cause, an asset-based tax plan structured around how the business actually operates, and ongoing CFO-level advisory to keep the structural decisions on track.
The results between 2021 and 2022:
- 94% revenue growth
- 401% profit increase
- $87,966 tax liability converted into a refund
The friction moment: there was real resistance early on to changing financial habits. The team was used to a “file taxes and pay” rhythm. Shifting to proactive structural decisions about pricing, recognition, and tax strategy required leadership to engage with finance differently — not as a reporting function but as an operating system. That took longer than the technical work.
The key insight from that engagement: tax savings get big when the strategy matches the way the company actually operates. Generic plans don’t move the needle. Structural plans do.
That’s the move from cash-tight to cash-rich at the same revenue level — and it’s the same playbook for building a business worth selling when the time comes.
How to diagnose your working capital gap in 20 minutes
You don’t need a CFO to run the first diagnostic. Here’s the math, in five steps.
- Calculate gross margin. (Revenue − direct delivery cost) ÷ revenue. Direct delivery cost = the people and tools required to deliver the work. Not admin, not sales, not your salary unless you’re personally delivering.
- Calculate your cash conversion cycle. Average days from when you incur the cost to deliver, to when the client pays. For most service businesses: average days to invoice + average days from invoice to payment.
- Calculate your working capital requirement. Daily delivery cost × cash conversion cycle days. That’s how much cash should be permanently locked up in operations.
- Compare to your actual cash on hand. If working capital requirement is higher than what’s in the bank, you’re financing the gap personally — through owner loans, deferred distributions, lines of credit, or vendor stretching.
- The gap is your problem. And the fastest way to close it is to lift gross margin (pricing + labor efficiency) before touching anything else.
If you run this and the number scares you, that’s the right reaction. It means you’ve been growing into a wall you couldn’t see.
Book a free Scale-Ready Assessment — three deliverables: full 60-15-15 financial diagnostic, a tax plan, and an enterprise value report showing your current multiple and the gap. 15 spots per month.
